Operational Forecast System for the Salish Sea & Columbia River
Project Team
Project Lead/Scientific PI: Tarang Khangaonkar, Pacific Northwest National Laboratory (PNNL)
CO-PI: Hydrologist-TBD, Modeling and TMDL Washington State Department of Ecology
Transition PI: Jan Newton, NANOOS, University of Washington
Federal Collaborator (Operator Lead): Patrick Burke, NOAA/NOS
Federal Collaborator (Science Advisor): Edward Myers, NOAA/NOS
NOAA/NOS Technical Points of Contact: Lei Shi, Edward Myers, Audra Luscher, Carolyn Lindley, Machuan Peng
Collaborating Partners: Amy MacFadyen and Chris Barker (NOAA Office of Response and Restoration); Robert Daniels and John Jacobs (NOAA National Centers for Coastal Ocean Science), David Michalsen (USACE, Seattle District), Rohinee Paranjpye (NOAA Fisheries)
Project Overview and Results
The Salish Sea is located on the Pacific Northwest coast of North America, spanning Puget Sound in Washington, USA, in the south, to the Georgia basin in British Columbia, Canada, to the north. The domain includes several Straits and Islands. This is a rapidly growing region that supports significant maritime commerce, and ship traffic which is expected to increase continuously in the coming years. In addition, the Salish Sea receives wastewater discharges from 99 wastewater outfalls from major cities, including Seattle, Tacoma, Everett, and Bellingham, in US and Victoria and Vancouver in Canada. In recent years millions of gallons of untreated wastewater have been accidentally discharged directly into Puget Sound due to overload and equipment failure. These events along with increased risk associated with potential maritime accidents and spills have resulted in heightened community-wide interest in real-time oceanographic information. Current predictions with sufficient spatial resolution and accuracy are needed for use in risk management from exposure to potential spills and in support of navigation and maritime emergency response. The National Oceanic and Atmospheric Administration/ National Ocean Services (NOAA/NOS) identified the Salish Sea region of the Pacific Northwest as a major data gap and the development of an Operational Forecast System (OFS) for the Salish Sea has become a high priority. In addition to NOAA mission goals and priorities related to navigation, the annually recurring hypoxic events, exposure of shellfish farms to corrosive waters, seasonal harmful algal blooms, occurrences of shellfish poisoning, and exposure to wastewater and stormwater, are ecosystem management related challenges faced by the communities that need and would benefit from realtime information from an OFS for this Salish Sea region.
The objective of this COMT project is to transition the Salish Sea Model (SSM) developed by the Pacific Northwest National Laboratory (PNNL) to an operational forecast system status, to be maintained by NOS, following major improvements in the form of grid resolution refinement and detailed skill assessment to reach the required readiness level. One obstacle to refinement and the development of a shoreline resolving intertidal scale model has been the lack of current measurements with sufficient coverage which could be used for robust model validation and testing. New acoustic doppler current profile (ADCP) data collected by the National Oceanic and Atmospheric Administration (NOAA) Center for Operational Oceanographic Products and Services (CO-OPS) from 135 stations in the Salish Sea over the years 2015 to 2017 fully addressed this data gap. The COMT project supported by this data set has led to the development of a high-resolution version of the coupled hydrodynamic and biogeochemical SSM. This was initially named “Salish Sea Model-Operational Forecast System (SSM-OFS)”. The SSM-OFS with a 10-fold increase in grid resolution and successful completion of testing using NOAA operational products and NOS skill assessment procedures demonstrated a readiness level for transition to operational status. As an additional part of this effort, the development and testing of the SSM Biogeochemical Model for potential application in Ecosystem Forecasting using the hydrodynamic files generated by SSM-OFS have also been completed.
In the third and final year of the COMT project, the objective of the project was amended. The NOAA-COOPS currently maintains a Columbia River Estuary Operational Forecast System (CREOFS). NOS expressed interest in upgrading and consolidating the Columbia River domain into one of the existing larger domain OFSs. Given the complexity of the Columbia River estuary shoreline, NOS requested that the Columbia River domain be included in SSM-OFS based on its similar unstructured grid finite volume formulation and funded the effort independently through the regional association NANOOS. The resulting model is the Salish Sea & Columbia River Operational Forecast System (SSCOFS), which has also achieved a readiness level for transition to NOS. The SSCOFS, in addition to the Salish Sea, incorporates 146 miles of Lower Columbia River domain from Astoria, OR at the mouth, to Bonneville Dam.
Operational forecast results are not yet ready. However, the transition of SSCOFS to NOS is underway. SSCOFS files have been transferred to NOAA-COOPs where they are being installed on the NOAA Coastal Ocean Modeling Framework (COMF) for testing and finalization.
Figure 1 below shows the overall SSCOFS domain (inset) along with a close up of the Salish Sea region. An example animation of currents and a hypothetical oil spill transport from the Haro Strait region near San Juan Islands is shown below.

Figure 1: Oceanographic regions of the Salish Sea (Puget Sound, the Strait of Juan de Fuca, and the Strait of Georgia). Inset shows the entire model domain. Monitoring data stations include Ecology monthly monitoring sites (green) and Puget Sound zooplankton monitoring sites (red). Transects A, B, and C are locations where volume flux (exchange flow) calculations were conducted.
Model Descriptions
Salish Sea Model:
SSM-OFS:
The Salish Sea Model (Khangaonkar et al. 2017, 2018) was originally developed to simulate hydrodynamic and biogeochemical cycles and response to nutrient pollution from numerous point and non-point sources. The model uses an unstructured grid-based Finite Volume Community Ocean Model (FVCOM; Chen et al., 2003) for hydrodynamics and an externally coupled model for biogeochemical water-quality kinetics (FVCOM-ICM; Kim and Khangaonkar, 2011). The model domain includes the Salish Sea basins of Puget Sound, the Strait of Juan De Fuca, and Georgia Basin, coastal waters around Vancouver Island, and the continental shelf from Canada’s Queen Charlotte Strait to Oregon’s Waldport (south of Yaquina Bay) as shown in Figure 1 The model also includes the Lower Columbia River and estuary up to Bonneville Dam and the Willamette River up to the Willamette Falls. The model has been extensively tested against monitoring data and has an established a good performance track record in large-scale computing exchange between the Salish Sea and the Pacific Ocean, overall circulation and inter-basin transport, and biogeochemical cycles, including DO and pH response to nutrient loading (Ahmed et. al. 2019, Khangaonkar et. al. 2017, 2018, 2019, and Khangaonkar et. al. 2021).
For use in operational forecasts by NOS, we determined that a 10-fold increase in resolution was needed, ranging from 50-100m cell size along the shoreline increasing to 200-400 m in Puget Sound to 400-1000 in the Straits to a 3 km resolution on the outer shelf. This would ensure that fine-scale phenomena such as eddies resulting from complex shoreline features, river mouths, or near the confluence of inner sub-basins, intertidal wetting and drying, and spatial gradients induced by shoreline complexity and islands were reproduced accurately. The model SSM-OFS was set up for three selected years; 2015, 2016, and 2017 based on the availability of a large currents data set produced by an ADCP survey program conducted by NOAA covering Puget Sound, the Strait of Juan de Fuca, and the San Juan Islands regions of the Salish Sea within U.S. waters. The model forcing and setup procedures are similar to those previously described in Khangaonkar et al., (2019 and 2021). This includes freshwater inflows to the Salish sea from 26 major gauged rivers, 135 ungauged streams estimated through hydrological analysis, and 99 wastewater water outfalls. Meteorological forcing inputs were obtained from the Weather Forecasting Research (WRF) model’s reanalysis data generated by the University of Washington for 2015 and 2016. The conditions at the open ocean boundary were extracted from the HYCOM (HYbrid Coordinate Ocean Model; Wallcraft et al., 2009) and reanalysis data at the nodal locations of the outer boundary.
The performance of the model was tested through comparison with measurements of water surface level (WSE), temperature (T), salinity (S), and currents. The observations for WSE were gathered from 13 water level stations in the Salish Sea domain from National Water Level Observation Network (NWLON), which is maintained by NOAA CO-OPS. The model skill in capturing the freshwater mixing and the estuarine exchange was tested against the measurements for T and S, obtained from 21 monitoring stations maintained by the Washington Department of Ecology. The currents were from the NOAA CO-OPS ADCP survey of Puget Sound mentioned previously. Figure 2 shows the locations of all data used in this study.
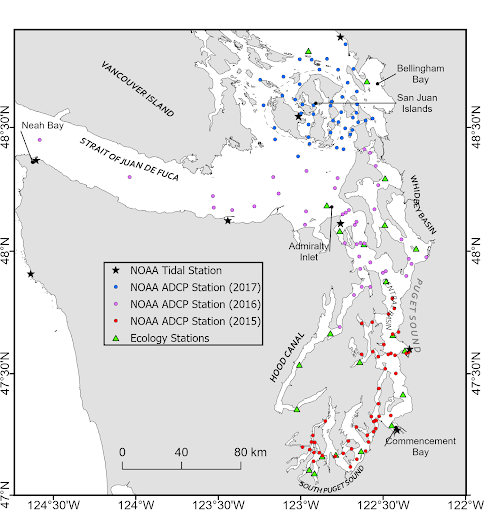
Figure 2. (a) Tides monitoring stations maintained by NOAA on the coast of Washington and inner Salish Sea ‘*’ (b) monthly monitoring stations maintained by the Washington State Department of Ecology (green triangles), and (c) NOAA ADCP stations (colored circles by the year)
Quantitative model skill assessment was conducted using National Ocean Service (NOS) procedures described in “User-based skill assessment techniques for operational hydrodynamic forecast systems' paper by Zhang et. al. (2010). Statistical parameters in the NOS skill assessment include the Root Mean Square Error (RMSE) and Central Frequency (CF) as key indicators of model performance. CF is defined as the percentage fraction of errors that lie within the predefined error limit. Results indicate that > 90% of the time, the model is within the defined error limit for WSE of (10 – 12) % of the tidal range at the selected stations.
Skill assessment for currents was conducted using the ADCP data. The RMSE values for velocity magnitudes satisfy the NOS criteria (< 0.26 m/s) for all three years, while the CF remains close to 90 % in both 2015 and 2016. Also, the model has been able to capture the phase of the barotropic currents relatively well, although the model scores are below the NOS benchmarks (RMSE < 36 ° and CF > 90%). The phase differences between the model-predicted and observed currents are attributed to the smoothing and bottom-roughness adjustments introduced to retain the appropriate vertical stratification, salinity gradients, and the accuracy of the resulting exchange flow. Overall model performance of predicting temperature and salinity in the form of error statistics at all stations was found to be comparable to the validation results as recorded in (Khangaonkar et al., 2021), with domain wide average temperature root-mean-square errors <0.73 °C, and salinity root-mean-square errors < 1.26 PSU.
SSCOFS:
While the SSM-OFS focuses on the inner Salish Sea geographical region, the model domain extends to the continental shelf boundary and includes several major coastal estuaries, including the Columbia River and its estuary, extending from the Bonneville Dam to its mouth near Astoria, OR. Although CO-OPS already maintains a Columbia River Estuary Operational Forecast System (CREOFS), it is based on a modeling framework that is no longer supported by NOAA. Successful development of the SSM-OFS has led to the decision to continue this work through the addition of the Columbia River to the SSM-OFS. Focusing on Columbia River-specific data acquisition and synthesis, iterative model refinement, skill assessment, and reporting, the project has resulted in a system that combines both domains into the SSCOFS. Relative to the baseline SSM, the SSCOFS model may be regarded as approximately 12-fold higher resolution Salish Sea Model with an embedded representation of the Lower Columbia River, also at a compatible higher resolution.
Figure 3 shows the evolution of the original Columbia River grid from SSM, to the intermediate refined version, and the final version of the Columbia River region of SSCOFS model grid. In parallel with grid refinement, the existing bathymetry (originally from the Eastern North Pacific ADCIRC model grid) was also updated using a more detailed and updated bathymetry provided by NOAA from the CREOFS.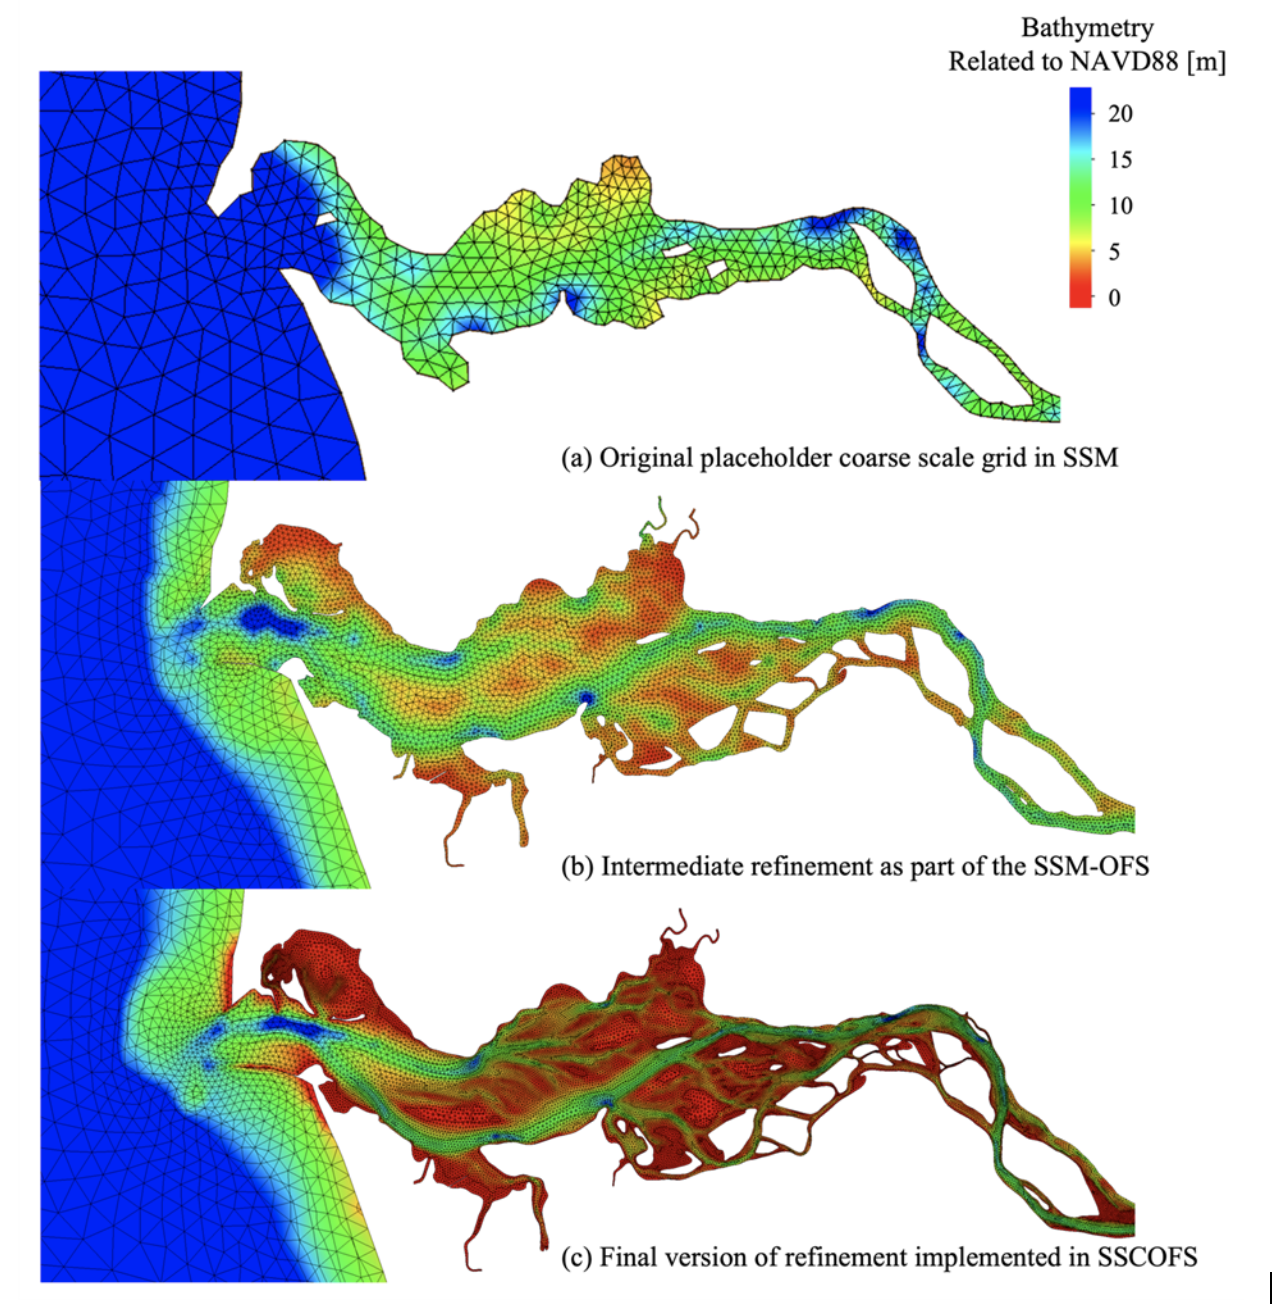
Figure 3: Evolution of Columbia River estuary region of the Salish Sea Model (a) Original placeholder coarse scale grid in SSM, (b) Intermediate refinement as part of the SSM-OFS model version grid, and (c) Final version of refinement implemented in SSCOFS model.
The SSCOFS was setup for 2017 as that was the first year with NOAA operational products data (HRRR meteorological forcing and GRTOFS ocean boundary) available for testing. River flows were specified using the NOAA National Water Model (NWM). Tidal constituents for the SSCOFS model were obtained from the ENPAC database and default values of river temperatures provided by the Washington State Department of Ecology were used for specifying Columbia River and Willamette River temperatures.
As part of skill assessment, we compared predicted WSE with data from 7 NOAA CO-OPS stations, and predicted S and T with data from 8 CMOP stations. Figure 4 shows the locations of the CMOP stations in blue and CO-OPS stations are shown in yellow. The skill assessment for WSE was conducted using NOAA procedures (Zhang et al. 2010., 2006).
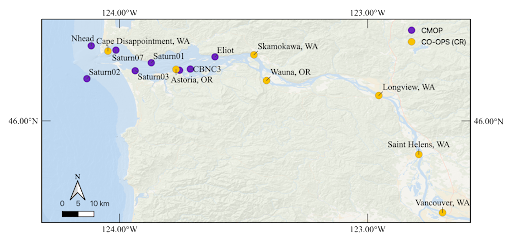
Figure 4. NOAA CO-OPS monitoring stations for WSE (7) and CMOP monitoring stations for salinity and temperature (8) used in the Columbia River model performance and skill assessment.
Figure 5 below shows the comparison between the predicted WSE (blue) and observation data (red). Results show that the estuary and lower parts of the Columbia River domain have higher model skills compared to the upper reaches. In addition, the model simulates high flow better compared to low flow. The reason could be that a high friction coefficient was needed to achieve the high flow WSE peak which also tends to retain water in the channel slowing the drainage. We expect fine-tuning the bathymetric resolution and spatial variation of bed friction could be used to improve the SA results.
Skill assessment results for the Columbia River domain indicate that RMSE levels are below 0.15 m at all stations except for the Vancouver and Saint Heles. The Series Mean (SM) or bias varies between -0.06 to 0.07 m. While the SM and RMSE metrics in general look good/reasonable the CF at most stations varies between 80-90% and is lower in the upper reaches of Longview, St. Helens, and Vancouver. However, based on our discussions with the NOAA CO-OPS team we understand that this performance is comparable to, or improves over, the existing CREOFS. Clearly, there is room for further improvement but it may require further model refinement and may come at the cost of computational efficiency.
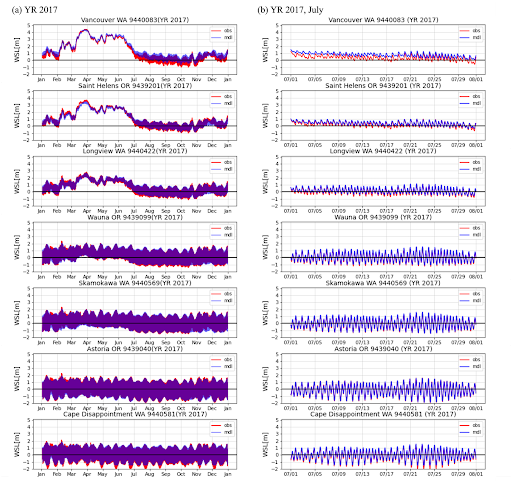 Figure 5 The comparison of predicted WSE (blue) and measured data (red)from the NOAA CO-OPS stations in the Columbia River region of SSCOFS. The left panel (a) shows the time series for the full year 2017, and the right panel (b) shows the example month July of the year 2017.
 Further improvement in model skill is possible in future projects including (a) further grid refinement, (b) addition of more model layers, and (c) improving bed friction and wind effect through machine learning techniques.
References
Ahmed, A., Figueroa-Kaminsky, C., Gala, J., Mohamedali, T., Pelletier, G., & McCarthy, S. (2019). Puget Sound Nutrient Source Reduction Project, Volume 1: Model Updates and Bounding Scenarios. Washington Department of Ecology, Publication, 19-03.
Chen, C., Liu, H., Beardsley, R.C., (2003). An unstructured, finite-volume, three-dimensional, primitive equation ocean model: application to coastal ocean and estuaries. J. Atmos. Ocean. Technol. 20,159–186.
Khangaonkar, T., Yang, Z., Kim, T., & Roberts, M. (2011). Tidally averaged circulation in Puget Sound sub-basins: Comparison of historical data, analytical model, and numerical model. Estuarine, Coastal and Shelf Science, 93(4), 305-319.
Khangaonkar, T., Long, W., & Xu, W. (2017). Assessment of circulation and inter-basin transport in the Salish Sea including Johnstone Strait and Discovery Islands pathways. Ocean Modelling, 109, 11-32.
Khangaonkar, T., Nugraha, A., Xu, W., Long, W., Bianucci, L., Ahmed, A., ... & Pelletier, G. (2018). Analysis of hypoxia and sensitivity to nutrient pollution in Salish Sea. Journal of Geophysical Research: Oceans, 123(7), 4735-4761. doi: 10.1029/2017JC013650
Khangaonkar, T., Nugraha, A., Xu, W., & Balaguru, K. ( 2019). Salish Sea Response to Global Climate Change, Sea Level Rise, and Future Nutrient Loads. Journal of Geophysical Research: Oceans, 124. https://doi.org/10.1029/2018JC014670
Khangaonkar, TK, L Premathilake, A Nugraha, J Keister, A Borde. (2021) Projections of algae, eelgrass, and zooplankton ecological interactions in the inner Salish Sea – for future climate, and altered oceanic states, Ecological Modelling, Volume 441, 2021, 109420, ISSN 0304-3800, https://doi.org/10.1016/j.ecolmodel.2020.109420.
Wallcraft, A. J., Metzger, E. J., & Carroll, S. N. (2009). Software design description for the hybrid coordinate ocean model (HYCOM), Version 2.2. Naval Research Lab Stennis Space Center Ms Oceanography Div.
Zhang, A., Hess, K. W., Wei, E., & Myers, E. (2006). Implementation of model skill assessment software for water level and current in tidal regions.
Zhang, A., K.W. Hess and F. Aikman. (2010): User-based Skill Assessment Techniques for Operational Hydrodynamic Forecast Systems, Journal of Operational Oceanography, Volume 3, Number 2, 11-24(14).